
Our Lady and St Philomena's Catholic Primary School
School Performance
Key Data Points
At the end of Reception, the Early Years Foundation Stage Profile (EYFSP) evaluates children across 17 learning goals via classroom observation. Reaching a Good Level of Development (GLD) means achieving expected standards in core areas: communication, personal development, physical skills, literacy, and maths.
In Year 1, the Phonics Screening Check (PSC) tests decoding by having pupils read 40 words out loud (20 real, 20 pseudo-words). Pupils missing the threshold mark receive support and retake it in Year 2.
In Year 4, the digital Multiplication Tables Check (MTC) tests rapid recall with 25 times-table questions up to 12 times 12, allowing 6 seconds per item.
In Year 6, pupils take formal KS2 SATs in May, covering Reading, Maths, and Grammar/Spelling, while Writing is teacher-assessed. Raw scores convert to scaled scores (80–120), where 100 marks the expected standard and 110+ signals greater depth.
Our Data
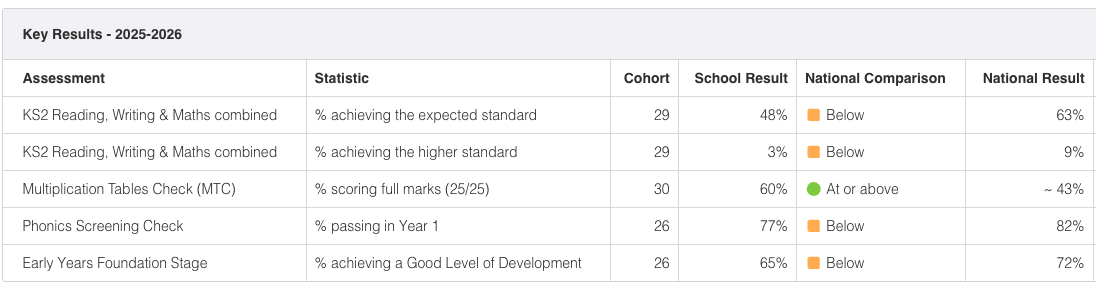
2025/26 marks a monumental achievement with three key areas reaching the highest results the school has EVER achieved.
Multiplication Tables Check (MTC):
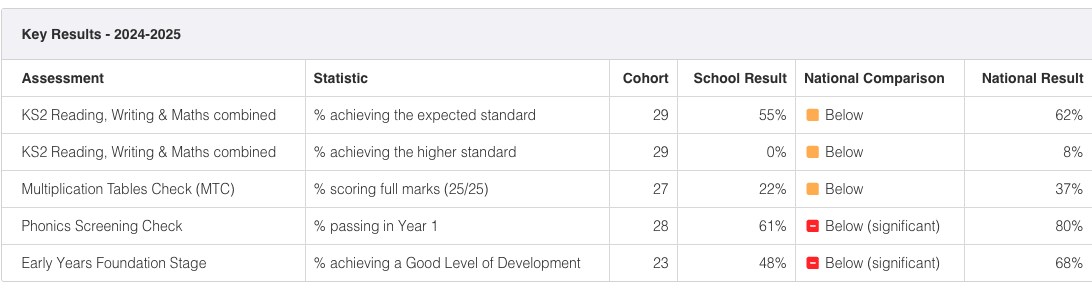
Skyrocketed from 22% (scoring full marks in 2024–25) all the way to 60% in 2025–26! Not only did the school smash its previous performance, but it also soared above the national average (~43%), moving from a "Below" status to proudly sitting "At or above"!
Phonics Screening Check (PSC):
Rose sharply from 61% to 77% passing in Year 1. Successfully shifted the national comparison status from Below (significant) up to a much stronger position, closing in rapidly on the national average of 82%.
Early Years Foundation Stage (EYFS):
Climbed impressively from 48% achieving a Good Level of Development to 65%. Like phonics, this successfully transitioned the school's comparison rating out of Below (significant) and right up to the threshold of national figures (72%).
School Performance Tables
The Department for Education school performance tables provide a public record of how effectively schools and colleges support pupil achievement and progress. This official service allows parents, governors and school leaders to compare the results of different educational establishments using key metrics such as exam results, Ofsted ratings and pupil absence rates.
By accessing these tables, you can view specific data for Our Lady and St. Philomena's Catholic Primary School to see how its performance aligns with national averages and local benchmarks. The website serves as a vital tool for transparency and helps families make informed decisions about their children's education.
School Performance table Department of Education School Performance table